
AR
Arweave价格
$4.9370
+$0.12800
(+2.66%)
过去 24 小时的价格变化

您认为 AR 今天会涨还是会跌?
您可以点赞或点踩来表达对该币种今日涨跌的预测
投票并查看结果
免责声明
本页面的社交内容 (包括由 LunarCrush 提供支持的推文和社交统计数据) 均来自第三方,并按“原样”提供,仅供参考。本文内容不代表对任何数字货币或投资的认可或推荐,也未获得欧易授权或撰写,也不代表我们的观点。我们不保证所显示的用户生成内容的准确性或可靠性。本文不应被解释为财务或投资建议。在做出投资决策之前,评估您的投资经验、财务状况、投资目标和风险承受能力并咨询独立财务顾问至关重要。过去的表现并不代表未来的结果。您的投资价值可能会波动,您可能无法收回您投资的金额。您对自己的投资选择自行承担全部责任,我们对因使用本信息而造成的任何损失或损害不承担任何责任。提供外部网站链接是为了用户方便,并不意味着对其内容的认可或控制。
请参阅我们的 使用条款 和 风险警告,了解更多详情。通过使用第三方网站(“第三方网站”),您同意对第三方网站的任何使用均受第三方网站条款的约束和管辖。除非书面明确说明,否则欧易及其关联方(“OKX”)与第三方网站的所有者或运营商没有任何关联。您同意欧易对您使用第三方网站而产生的任何损失、损害和任何其他后果不承担任何责任。请注意,使用第三方网站可能会导致您的资产损失或贬值。本产品可能无法在所有司法管辖区提供或适用。
请参阅我们的 使用条款 和 风险警告,了解更多详情。通过使用第三方网站(“第三方网站”),您同意对第三方网站的任何使用均受第三方网站条款的约束和管辖。除非书面明确说明,否则欧易及其关联方(“OKX”)与第三方网站的所有者或运营商没有任何关联。您同意欧易对您使用第三方网站而产生的任何损失、损害和任何其他后果不承担任何责任。请注意,使用第三方网站可能会导致您的资产损失或贬值。本产品可能无法在所有司法管辖区提供或适用。
Arweave 市场信息
市值
市值是通过流通总应量与最新价格相乘进行计算。市值 = 当前流通量 × 最新价
流通总量
目前该代币在市场流通的数量
市值排行
该资产的市值排名
历史最高价
该代币在交易历史中的最高价格
历史最低价
该代币在交易历史中的最低价格
24 小时最高
$4.9610
24 小时最低
$4.5010
历史最高价
$71.0600
-93.06% (-$66.1230)
最后更新日期:2022年1月4日 (UTC+8)
历史最低价
$3.7040
+33.28% (+$1.2330)
最后更新日期:2023年10月9日 (UTC+8)
Arweave 动态资讯
以下内容源自 。

HDAO
$FIL 与 $BTT:谁的经济引擎更强? ⚙️📊
我们请 DD 分析了背后的经济模型——以下是突出的要点:
🔹 $FIL
基于存储即服务模型。矿工必须锁定抵押品才能赚取 $FIL,这使得激励与可靠性和长期存储相一致。供应缓慢释放,成本与实际硬件和正常运行时间挂钩——这使得它成为一个更强大、以实用为驱动的经济体。
🔸 $BTT
专注于带宽和速度激励。用户支付 $BTT 来加速下载,而播种者则赚取代币。虽然模型更轻量且易于接入,但它严重依赖用户需求,并且不要求参与者锁定价值——这可能削弱长期经济稳定性。
💡来自 Double D 的裁决:
$FIL 显示出可持续、可扩展经济体的更强基本面,但 $BTT 在可接入性和无摩擦参与方面表现出色。
你认为哪个模型在长期内会获胜? 👇 $BTC $ETH $WAL $AR $BCH $XEC $LINK $SOL
查看原文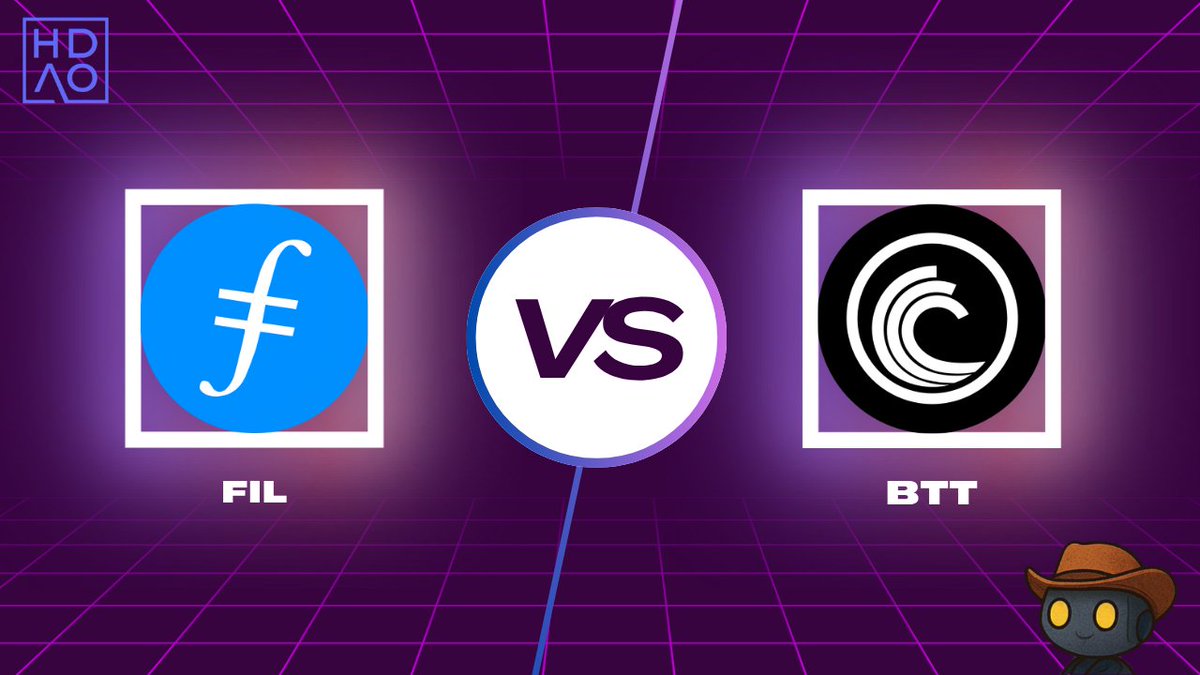
7.76万
14

Evan
今天这些股票在某个时刻都达到了新的52周高点
Robinhood $HOOD
$IBM
Raytheon $RTX
Cloudflare $NET
Charles Schwab $SCHW
Roblox $RBLX
Take-Two $TTWO
$ASTS
Alnylam $ALNY
Antero $AR
BNY Mellon $BK
Cardinal Health $CAH
Crown Cork $CCK
Mr. Cooper $COOP
Credo $CRDO
Corteva $CTVA
Expand Energy $EXE
Flextronics $FLEX
Kratos $KTOS
MP Materials $MP
Newmont $NEM
Seagate $STX
$TD
查看原文8.01万
185
AR 计算器


Arweave 价格表现 (美元)
Arweave 当前价格为 $4.9370。Arweave 的价格在过去 24 小时内上涨了 +2.66%。目前,Arweave 市值排名为第 0 名,实时市值为 $3.23亿,流通供应量为 65,454,186 AR,最大供应量为 66,000,000 AR。我们会实时更新 Arweave/USD 的价格。
今日
+$0.12800
+2.66%
7 天
-$1.0690
-17.80%
30 天
-$2.3890
-32.61%
3 个月
-$2.5820
-34.34%
关于 Arweave (AR)
此评级是欧易从不同来源收集的汇总评级,仅供一般参考。欧易不保证评级的质量或准确性。欧易无意提供 (i) 投资建议或推荐;(ii) 购买、出售或持有数字资产的要约或招揽;(iii) 财务、会计、法律或税务建议。包括稳定币和 NFT 的数字资产容易受到市场波动的影响,风险较高,波动较大,可能会贬值甚至变得一文不值。数字资产的价格和性能不受保证,且可能会发生变化,恕不另行通知。您的数字资产不受潜在损失保险的保障。 历史回报并不代表未来回报。欧易不保证任何回报、本金或利息的偿还。欧易不提供投资或资产建议。您应该根据自身的财务状况仔细考虑交易或持有数字资产是否适合您。具体情况请咨询您的专业法务、税务或投资人士。
展开更多
- 官网
- 白皮书
- Github
- 区块浏览器
关于第三方网站
关于第三方网站
通过使用第三方网站(“第三方网站”),您同意对第三方网站的任何使用均受第三方网站条款的约束和管辖。除非书面明确说明,否则 OKX 及其关联方(“OKX”)与第三方网站的所有者或运营商没有任何关联。您同意 OKX 对您使用第三方网站而产生的任何损失、损害和任何其他后果不承担任何责任。请注意,使用第三方网站可能会导致您的资产损失或贬值。
Arweave 常见问题
Arweave 今天值多少钱?
目前,一个 Arweave 价值是 $4.9370。如果您想要了解 Arweave 价格走势与行情洞察,那么这里就是您的最佳选择。在欧易探索最新的 Arweave 图表,进行专业交易。
数字货币是什么?
数字货币,例如 Arweave 是在称为区块链的公共分类账上运行的数字资产。了解有关欧易上提供的数字货币和代币及其不同属性的更多信息,其中包括实时价格和实时图表。
数字货币是什么时候开始的?
由于 2008 年金融危机,人们对去中心化金融的兴趣激增。比特币作为去中心化网络上的安全数字资产提供了一种新颖的解决方案。从那时起,许多其他代币 (例如 Arweave) 也诞生了。
Arweave 的价格今天会涨吗?
查看 Arweave 价格预测页面,预测未来价格,帮助您设定价格目标。
ESG 披露
ESG (环境、社会和治理) 法规针对数字资产,旨在应对其环境影响 (如高能耗挖矿)、提升透明度,并确保合规的治理实践。使数字代币行业与更广泛的可持续发展和社会目标保持一致。这些法规鼓励遵循相关标准,以降低风险并提高数字资产的可信度。
资产详情
名称
OKcoin Europe LTD
相关法人机构识别编码
54930069NLWEIGLHXU42
代币名称
Arweave
共识机制
Arweave is present on the following networks: Arweave, Ethereum.
Arweave employs a unique Proof of Access (PoA) consensus mechanism, which integrates a requirement for miners to provide cryptographic proof of access to historical data, known as a "recall block." This ensures that miners contribute to both data storage and network security by storing and verifying historical data. Core Components: 1. Proof of Access (PoA): Recall Block Verification: During mining, miners must retrieve and validate a randomly selected "recall block" from Arweave’s data history, proving they retain access to stored data. This process secures the network while emphasizing long-term data availability. Enhanced Proof of Work (PoW): PoA builds upon traditional PoW by requiring miners to demonstrate access to previously stored data, adding a storage-focused layer to network security and incentivizing distributed data retention. 2. Data-Centric Mining Incentives: Distributed Storage: The PoA design encourages miners to store a broad history of blocks, as possessing more recall blocks enhances their probability of successfully mining new blocks and earning rewards.
The crypto-asset's Proof-of-Stake (PoS) consensus mechanism, introduced with The Merge in 2022, replaces mining with validator staking. Validators must stake at least 32 ETH every block a validator is randomly chosen to propose the next block. Once proposed the other validators verify the blocks integrity. The network operates on a slot and epoch system, where a new block is proposed every 12 seconds, and finalization occurs after two epochs (~12.8 minutes) using Casper-FFG. The Beacon Chain coordinates validators, while the fork-choice rule (LMD-GHOST) ensures the chain follows the heaviest accumulated validator votes. Validators earn rewards for proposing and verifying blocks, but face slashing for malicious behavior or inactivity. PoS aims to improve energy efficiency, security, and scalability, with future upgrades like Proto-Danksharding enhancing transaction efficiency.
奖励机制与相应费用
Arweave is present on the following networks: Arweave, Ethereum.
Arweave’s economic model incentivizes miners to contribute to data storage through upfront storage fees and ongoing block rewards, supporting the network’s mission of providing permanent and accessible data storage. Incentive Mechanisms: 1. One-Time Storage Fees: Permanent Data Storage: Users pay a one-time, upfront fee in AR tokens, calculated based on data size and projected storage costs. This fee funds indefinite data storage on the network. Endowment Pool: A portion of each storage fee is allocated to an endowment pool, covering future storage costs as technology advances, ensuring sustainable, permanent data storage. 2. Mining Rewards: Block Rewards: Miners earn AR tokens for successfully mining blocks, incentivizing them to store historical data and maintain network integrity. Applicable Fees: 1. Data Storage Fees: Market-Based Cost: Storage fees in AR are set by data size and projected long-term costs, covering the initial and future costs of data permanence.
The crypto-asset's PoS system secures transactions through validator incentives and economic penalties. Validators stake at least 32 ETH and earn rewards for proposing blocks, attesting to valid ones, and participating in sync committees. Rewards are paid in newly issued ETH and transaction fees. Under EIP-1559, transaction fees consist of a base fee, which is burned to reduce supply, and an optional priority fee (tip) paid to validators. Validators face slashing if they act maliciously and incur penalties for inactivity. This system aims to increase security by aligning incentives while making the crypto-asset's fee structure more predictable and deflationary during high network activity.
信息披露时间段的开始日期
2024-06-14
信息披露时间段的结束日期
2025-06-14
能源报告
能源消耗
629406.39109 (kWh/a)
可再生能源消耗
24.134704470 (%)
能源强度
0.00000 (kWh)
主要能源来源与评估体系
To determine the proportion of renewable energy usage, the locations of the nodes are to be determined using public information sites, open-source crawlers and crawlers developed in-house. If no information is available on the geographic distribution of the nodes, reference networks are used which are comparable in terms of their incentivization structure and consensus mechanism. This geo-information is merged with public information from Our World in Data, see citation. The intensity is calculated as the marginal energy cost wrt. one more transaction.
Ember (2025); Energy Institute - Statistical Review of World Energy (2024) – with major processing by Our World in Data. “Share of electricity generated by renewables – Ember and Energy Institute” [dataset]. Ember, “Yearly Electricity Data Europe”; Ember, “Yearly Electricity Data”; Energy Institute, “Statistical Review of World Energy” [original data]. Retrieved from https://ourworldindata.org/grapher/share-electricity-renewables
能源消耗来源与评估体系
The energy consumption of this asset is aggregated across multiple components:
For the calculation of energy consumptions, the so called “bottom-up” approach is being used. The nodes are considered to be the central factor for the energy consumption of the network. These assumptions are made on the basis of empirical findings through the use of public information sites, open-source crawlers and crawlers developed in-house. The main determinants for estimating the hardware used within the network are the requirements for operating the client software. The energy consumption of the hardware devices was measured in certified test laboratories. When calculating the energy consumption, we used - if available - the Functionally Fungible Group Digital Token Identifier (FFG DTI) to determine all implementations of the asset of question in scope and we update the mappings regulary, based on data of the Digital Token Identifier Foundation.
To determine the energy consumption of a token, the energy consumption of the network(s) ethereum is calculated first. For the energy consumption of the token, a fraction of the energy consumption of the network is attributed to the token, which is determined based on the activity of the crypto-asset within the network. When calculating the energy consumption, the Functionally Fungible Group Digital Token Identifier (FFG DTI) is used - if available - to determine all implementations of the asset in scope. The mappings are updated regularly, based on data of the Digital Token Identifier Foundation.
排放报告
DLT 温室气体排放范围一:可控排放
0.00000 (tCO2e/a)
DLT 温室气体排放范围二:外购排放
259.31292 (tCO2e/a)
温室气体排放强度
0.00000 (kgCO2e)
主要温室气体来源与评估体系
To determine the GHG Emissions, the locations of the nodes are to be determined using public information sites, open-source crawlers and crawlers developed in-house. If no information is available on the geographic distribution of the nodes, reference networks are used which are comparable in terms of their incentivization structure and consensus mechanism. This geo-information is merged with public information from Our World in Data, see citation. The intensity is calculated as the marginal emission wrt. one more transaction.
Ember (2025); Energy Institute - Statistical Review of World Energy (2024) – with major processing by Our World in Data. “Carbon intensity of electricity generation – Ember and Energy Institute” [dataset]. Ember, “Yearly Electricity Data Europe”; Ember, “Yearly Electricity Data”; Energy Institute, “Statistical Review of World Energy” [original data]. Retrieved from https://ourworldindata.org/grapher/carbon-intensity-electricity Licenced under CC BY 4.0
AR 计算器











社媒平台热度