Sonic Price Analysis: Parabolic Indicator Supports 10% Breakout Ahead $78M Token Unlock
Sonic S $0.33 24h volatility: 0.5% Market cap: $1.06 B Vol. 24h: $113.78 M price crossed the $0.34 mark on Thursday, July 3, rising 15% in 48 hours as traders place last-minute trades ahead of an upcoming unlock event. Technical indicators suggest more upside potential ahead if certain conditions persist.
Sonic Nears $1B Market Cap as Speculative Trades Trigger 10% Rally
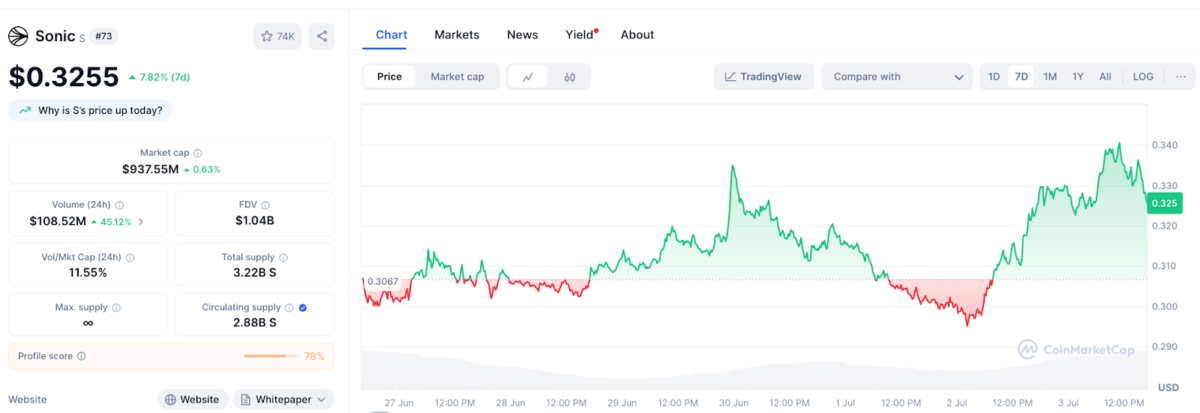
Andre Cronje-led Sonic delivers double-digit gains on Wednesday, rising 15% to reclaim the $0.33 level at press time. While the Sonic rally aligns with broader market sentiment, reports suggest this rapid price uptick could be linked to network development updates and anticipation surrounding upcoming ecosystem events.

Sonic price action | Source: Coinmarketcap
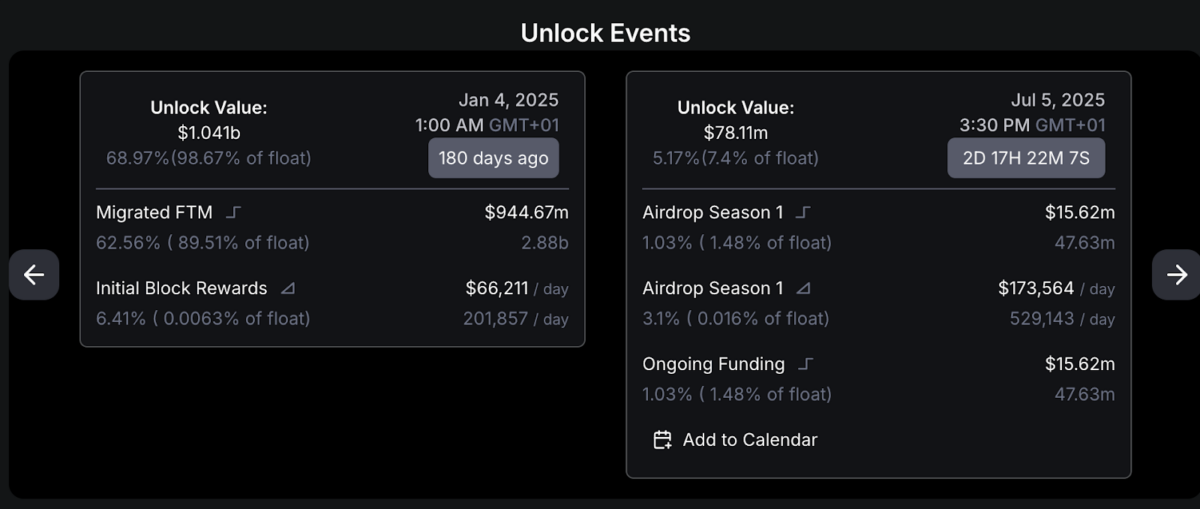
According to DeFiLlama data, Sonic is set to unlock $78.1 million worth of tokens on Friday, July 5. Token unlocks are typically perceived as bearish events due to the potential dilution of market supply. However, speculative traders often enter bullish positions ahead of such milestones, betting on heightened activity and liquidity.

Sonic Token Unlock Scheduled for July 5, 2025 | Source: DeFillam
This pre-unlock optimism may explain Sonic’s sharp 10% intraday rally and the token’s current valuation hovering near the $975 million mark, according to CoinMarketCap data.
Trading volume for Sonic has also surged above $90 million, a level not seen since June 27, 2025. This highlights a surge in market participation as investors prepare for post-unlock volatility.
Sonic Price Prediction: Can SONIC Breach the $0.35 Barrier?
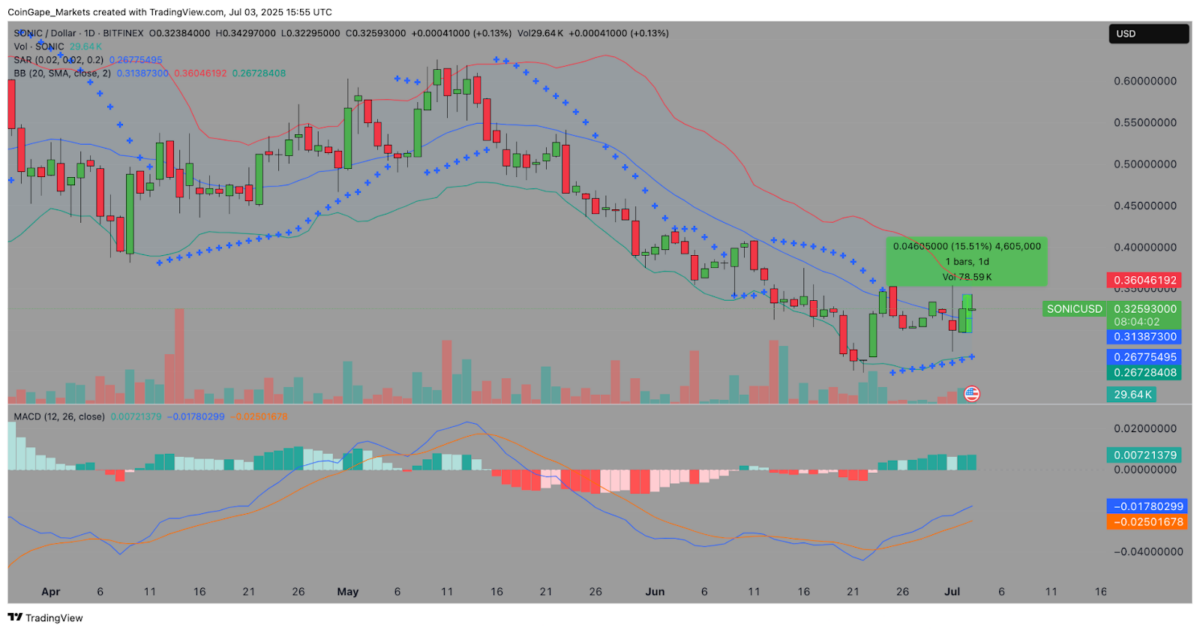
Technical analysis shows Sonic price breaking above the 20-day Simple Moving Average (SMA) at $0.31, which now acts as a vital short-term support level. This bullish momentum is further validated by the Parabolic Stop and Reverse (SAR) indicator, represented by blue dots beneath recent price candles, suggesting an active uptrend.

Sonic price prediction
Additionally, the Bollinger Bands, a volatility indicator comprising an upper, middle, and lower band, are starting to widen. This expansion suggests growing volatility and the potential for stronger price swings. If Sonic maintains its position above the middle band at $0.31, it could aim for the upper resistance near $0.36.
Lastly, the MACD (Moving Average Convergence Divergence) shows a bullish crossover. The MACD line has crossed above the signal line with positive histogram bars, a classic indication that buyer momentum is returning. If Sonic sustains this trend, it could challenge and break above the psychological $0.35 level, and potentially target $0.38 in the days ahead.
Best Wallet: Safely Store Your Sonic Tokens, Join the Multichain Future
As the Sonic ecosystem continues to evolve and token unlock events increase liquidity, secure storage becomes essential. Best Wallet emerges as the go-to non-custodial solution for users interacting with fast-moving assets like SONIC.
Now in presale, the $BEST token unlocks a suite of features within the Best Wallet ecosystem, offering early access to project launches, reduced fees, and elevated staking yields. With native support for Ethereum ETH $2 584 24h volatility: 0.4% Market cap: $311.76 B Vol. 24h: $23.94 B , Solana SOL $151.5 24h volatility: 0.3% Market cap: $81.01 B Vol. 24h: $4.83 B , Arbitrum ARB $0.34 24h volatility: 2.5% Market cap: $1.71 B Vol. 24h: $330.13 M , and all top Layer-1 and Layer-2 chains, Best Wallet empowers users to manage Sonic and other tokens from a single secure interface.
Whether you’re trading Sonic or holding for long-term growth, Best Wallet ensures your assets remain accessible and protected. Visit the official website to buy $BEST token now.
nextThe post Sonic Price Analysis: Parabolic Indicator Supports 10% Breakout Ahead $78M Token Unlock appeared first on Coinspeaker.
