Will Dogecoin Price Surge to $3 After Completing This Bullish Triangle?

Key Insights:
- Dogecoin price faced key on-chain resistance at $0.18, $0.21, and $0.36, with over 20% of the supply last moved near these price levels.
- A monthly chart shows Dogecoin repeating a symmetrical triangle pattern that preceded past parabolic rallies.
- If Dogecoin breaks above $0.21 with volume, technical and on-chain data align for a potential move toward $3 or higher.
Dogecoin (DOGE) price has indicated a possibility of entering into one of its common bullish patterns on a monthly chart.
Consequently, this has attracted the interest of investors who monitor past price patterns. Additionally, analysts observed whether this trend would trigger yet another breakout like those in the past.
Dogecoin Price Faces Resistance Between $0.18 and $0.36
On-chain data from Glassnode showed that more than 20% of the Dogecoin supply was last moved around $0.073. Nevertheless, three significant resistance areas were formed according to the UTXO Realized Price Distribution (URPD) data: $0.18, $0.21, and $0.36.
In addition, these levels represent price ranges where a large portion of DOGE holders previously acquired their tokens. Therefore, traders may attempt to exit positions once the price revisits these areas, creating supply pressure.
Analyst Ali Martinez noted that roughly 8.9% of the DOGE supply was transacted around $0.18, 7.2% around $0.21, and 3.8% near $0.36. These resistance points could delay upward momentum unless the market absorbs sell orders with sufficient demand.
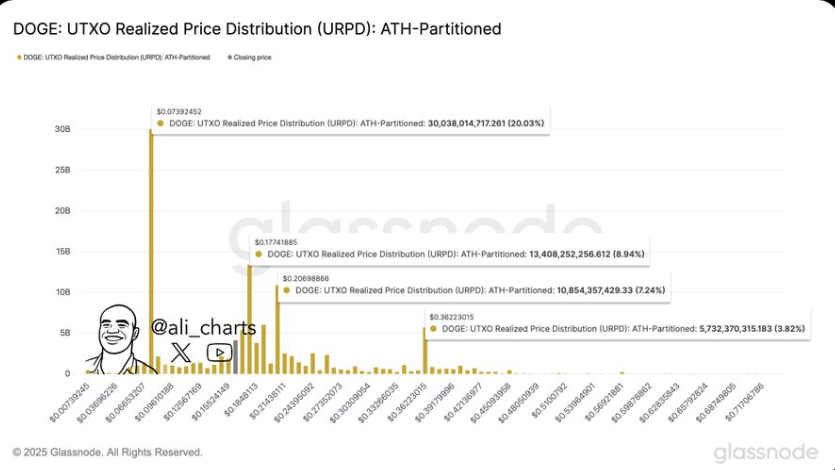
The existence of such clusters implied that any breakout activity can face multiple, congested supplying regions before any subsequent gains can be maintained.
Repeating Triangle Structure Mirrors Earlier Breakouts
Technically, a repeated cycle of compression and sharp upsurge was seen in the Dogecoin price monthly chart. Analyst Trader Tardigrade identified a symmetrical triangle formation in the 1-month timeframe.
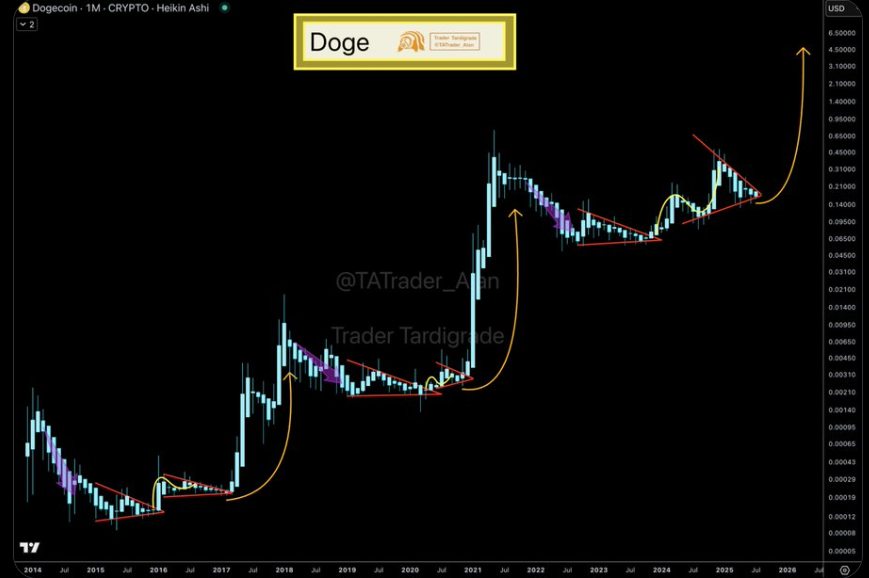
Besides, the trend resembled previous periods of the Dogecoin price long-term chart, when the compression levels were narrow and then followed the vertical races.
The recurring nature of this setup suggests that Dogecoin price may be approaching another breakout stage. The most recent structure includes a clear downtrend line intersecting with rising support, compressing the price into a narrow apex.
In prior cycles, similar configurations triggered parabolic advances once resistance lines were breached. If this trend repeats, the technical setup points toward a potential continuation move.
Dogecoin Price Structure Builds Toward Breakout
At the time of writing, Dogecoin price had not broken the $0.21 mark, regarded as crucial in the case of a bullish confirmation. A move beyond this level with higher volume may confirm the symmetrical triangle pattern and start a resumption of the long-term trend.
Historical fractals will confirm this scenario, where historical triangle breakouts have ended with multi-month rises.
If $0.21 is cleared with strong volume, the next overhead barrier remains near $0.36. Breaching this area would clear much of the historical sell wall observed in the URPD chart.
Furthermore, the absence of heavy supply above $0.36 could allow price discovery to extend beyond $1, with some technical projections pointing to $3 based on the vertical range of the triangle pattern.
DOGE Price: Double Bottom Pattern Targets $0.476
In a separate analysis, Trader Tardigrade spotted a potential double bottom formation going on the Dogecoin price daily chart. It usually indicates a whole potential reversal structure on the upside.
The pattern spanned several months, with two low points around the $0.13–$0.14 range and a neckline situated near $0.265.
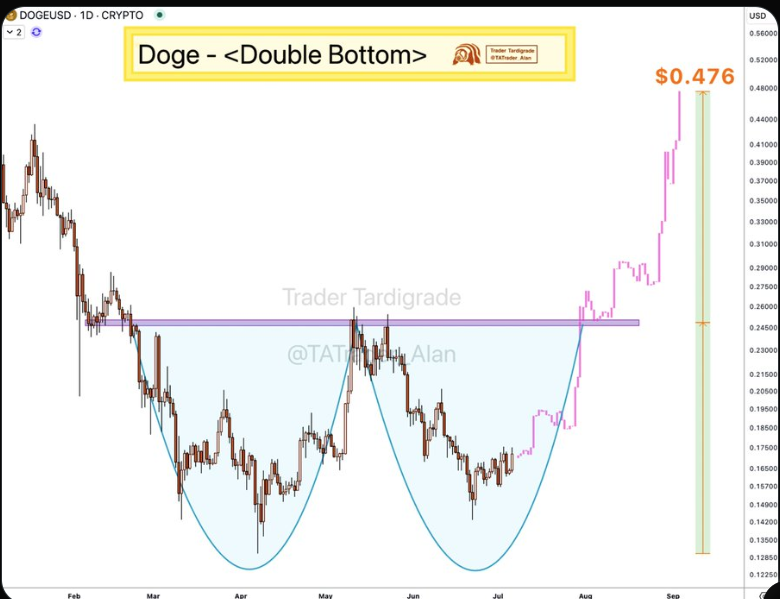
Moreover, the structure implied an imminent price recovery should the neckline breach be on volume, and the trend also suggests that a price recovery is ready to occur after a lengthy downtrend.
According to this chart pattern, the analyst has forecast a Dogecoin price target of $0.476. This was based on the vertical difference between the neckline and the bottom. The line in pink on the chart represented the possible breakout route should the momentum extend beyond the neckline.
Such a short-term goal matched previous resistance lines and emphasized the importance of the $0.26-0,27 bracket as a breakout area.
The post Will Dogecoin Price Surge to $3 After Completing This Bullish Triangle? appeared first on The Coin Republic.