Dogecoin Looking At Bullish Price Action, Watch Out For These Signs
Dogecoin price action has returned to a historically recurring accumulation zone, which has repeatedly triggered major upward moves.
This zone, located within the lower bounds of a long-term logarithmic channel, previously marked the start of substantial rallies, each yielding gains of between 900% and 13,000%.
Dogecoin Price Returns to Recurring Buy Zone
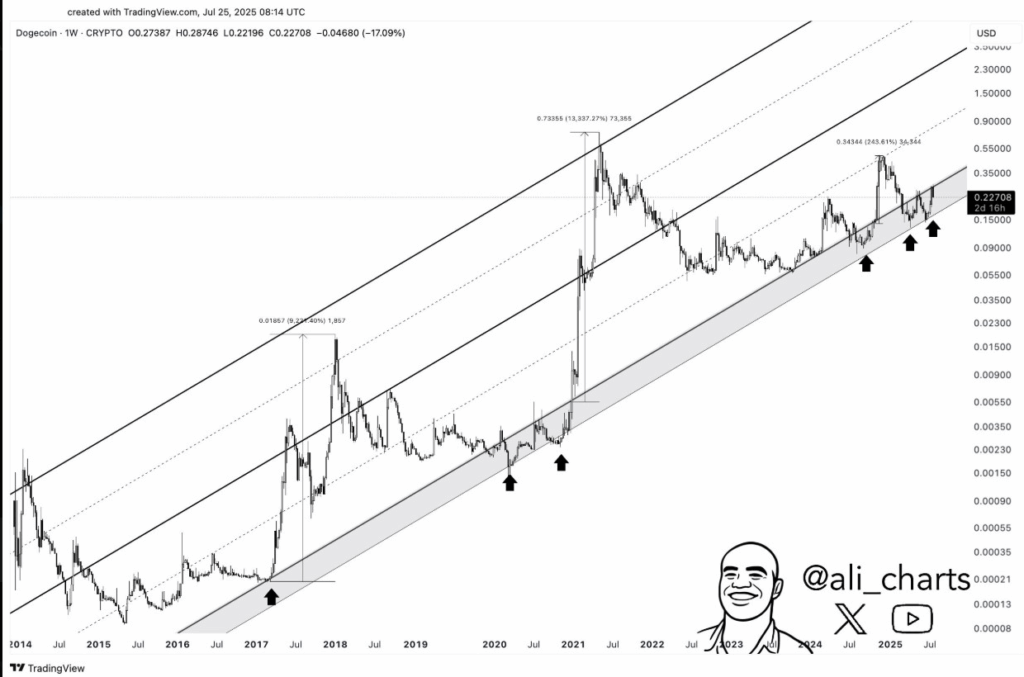
In a recent post on X, analyst Ali Martinez presented a long-term logarithmic chart of Dogecoin. The analyst showed that the meme coin reentered a zone historically associated with large bullish reversals.
This accumulation range, outlined at the lower boundary of a rising channel, supported price action since 2015.
The area around $0.15 to $0.22 has acted as a technical floor, where previous rallies were initiated following prolonged consolidation periods.
The chart showed at least four distinct points where Dogecoin rebounded after testing this lower region, each time forming a strong base for vertical growth.
The most notable breakout occurred in 2021 when DOGE price surged from the accumulation band to a peak of $0.7335.

Dogecoin price is once again testing the same support range seen in past cycles. This suggested the current structure may be repeating the multi-year trend.
DOGE Mid-Channel Resistance Becomes the First Key Target
Notably, the midline of the ascending channel, currently at around $0.73, served as a critical resistance level. In 2021, this zone acted as a breakout point during Dogecoin price largest rally in history.
According to the chart, if the current cycle mimics past trends, a move toward this level could be the next logical step if buyers maintain control above the accumulation band.
Market data indicated Dogecoin price had already made four higher lows while maintaining its position inside the channel.
These reactions suggested that buyer activity is increasing in areas previously viewed as undervalued.
If trading volume continues to build, the $0.73 area could come under pressure as the next technical level of interest.
A sustained push beyond this midpoint could open the door to further upside toward the top of the historical structure.
Upper Channel Resistance Aligns With Cycle Peak Targets
Should Dogecoin price follow the full range of its previous channel rallies, the upper boundary now lies between $2.30 and $3.00. This level matches the projected extension of the current logarithmic trend.
The chart indicated that such a move would align with the DOGE price history seen in 2017 and 2021. Both years, the meme coin followed similar technical progressions from the lower boundary to the upper range.
In previous cases, these upper levels were reached rapidly once momentum was confirmed above the mid-channel line.
The pattern suggests that once Dogecoin price crosses the $0.73 threshold, a continued surge could occur if market structure remains intact.
However, this projection depends on broader market conditions and sustained confirmation of trend continuation above the midline.
According to recent analysts, the top meme coin could rally over 600% if current trends persist.
The combination of whale accumulation, MACD crossover, and a double bottom retest suggested Dogecoin price may target the $0.60 to $0.70 range.
Hourly Breakout Signals Short-Term Bullish Shift
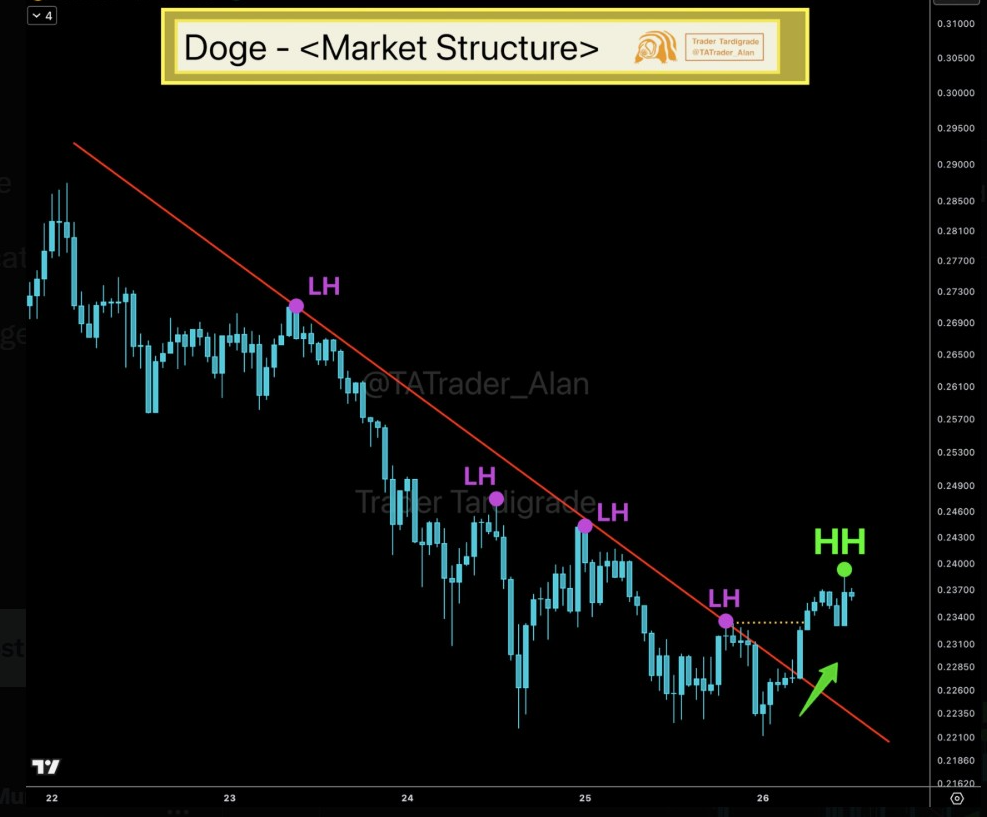
On a separate chart shared by analyst TATrader_Alan, Dogecoin price broke above a descending resistance trendline.
The chart documented a series of lower highs before DOGE breached the trendline and printed a new higher high (HH).
This development marked a short-term structural change and opened the path for a potential reversal in lower time frames.

The breakout came following several unsuccessful tries to extend beyond the resistance that appeared to go downward.
After the HH, analysts focused on the next higher low that will signal the reversal in trend. In the case where DOGE price produces this higher low and sustains an upward move, intraday objectives may stretch to around $0.24 and above to $0.255.
This would confirm the longer-term bullish picture noted in the weekly chart, and this may be a precursor to a new phase of investor demand.
The top meme coin has gained 2.5 percent within the last 24 hours and is currently exchanging hands at 0.2368.
Dogecoin’s market capitalization increased to $35.58 billion, whereas daily trading volumes fell to 2.27 billion.
The post Dogecoin Looking At Bullish Price Action, Watch Out For These Signs appeared first on The Coin Republic.
