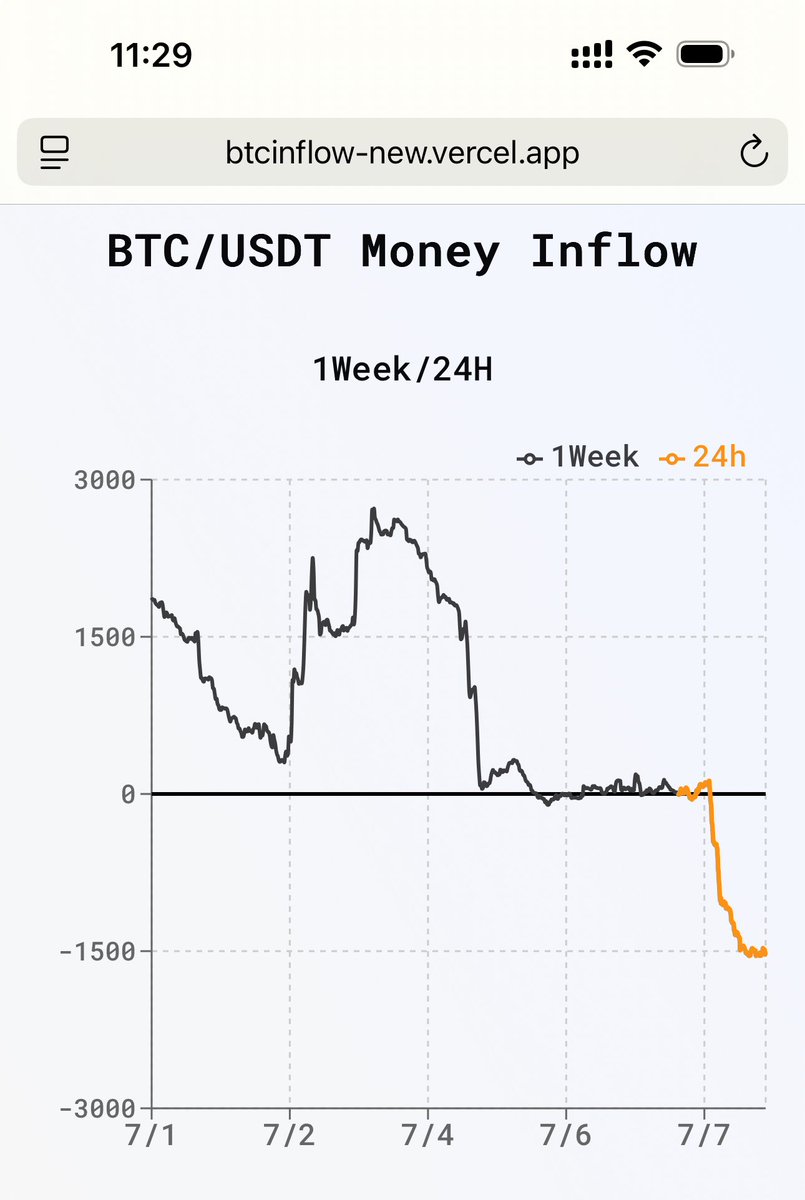
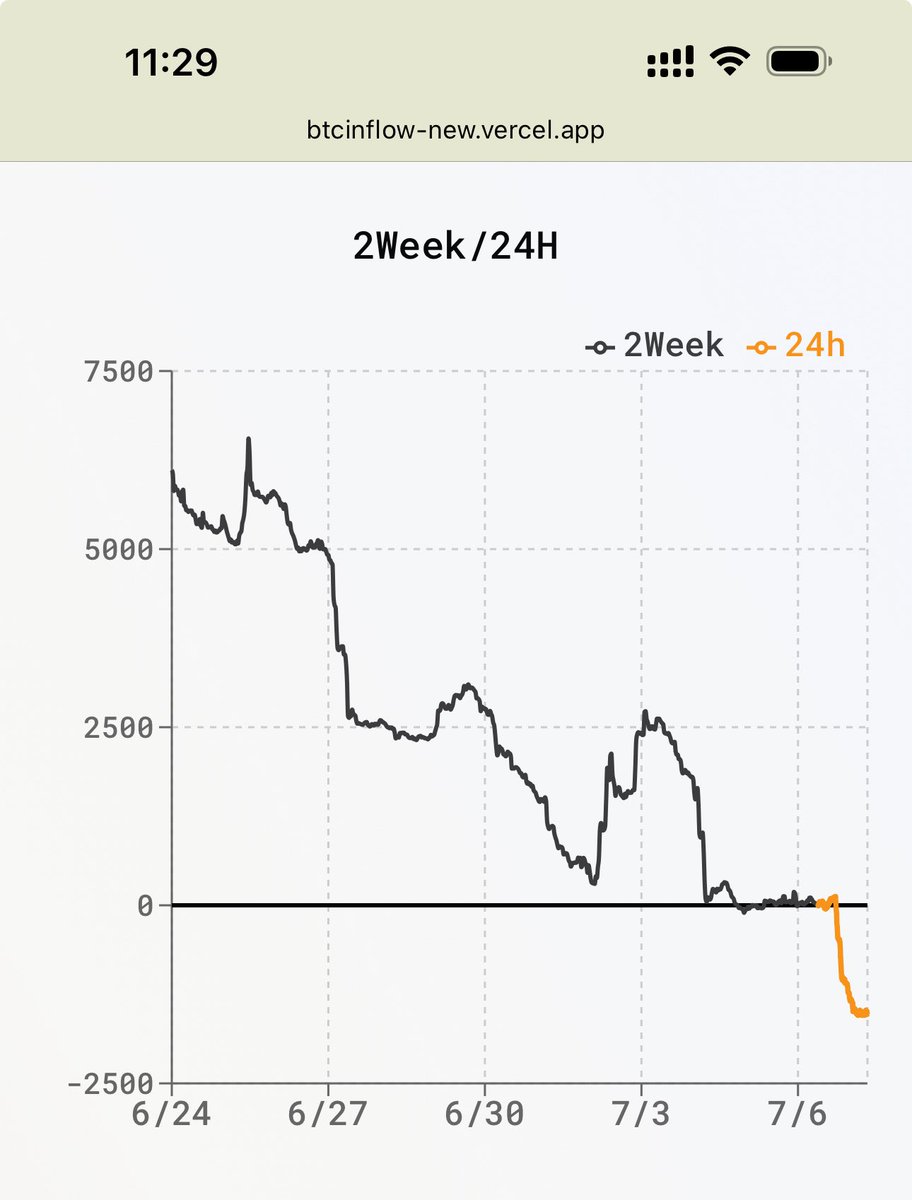
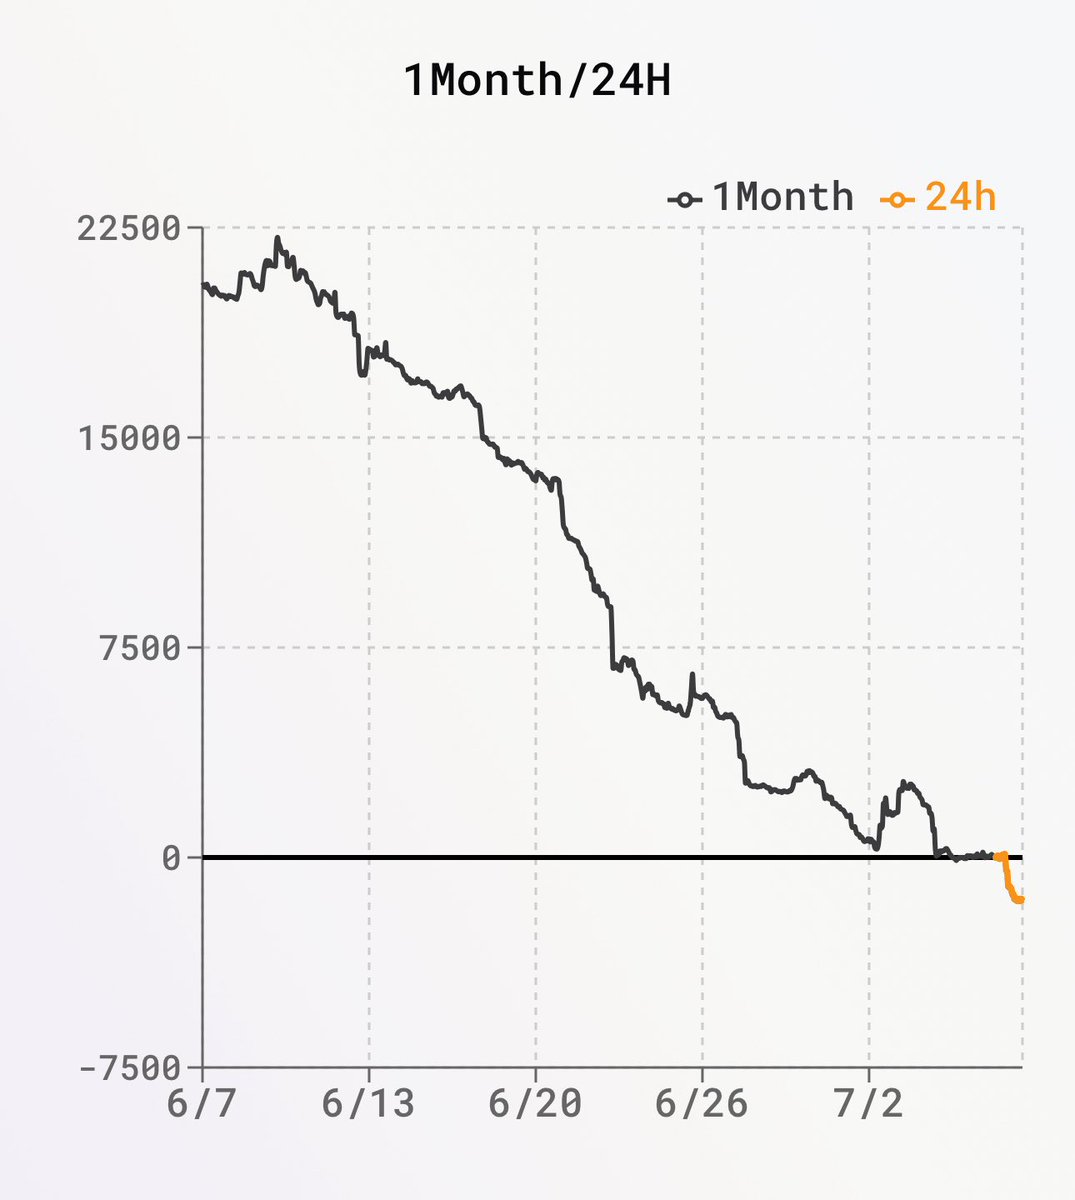
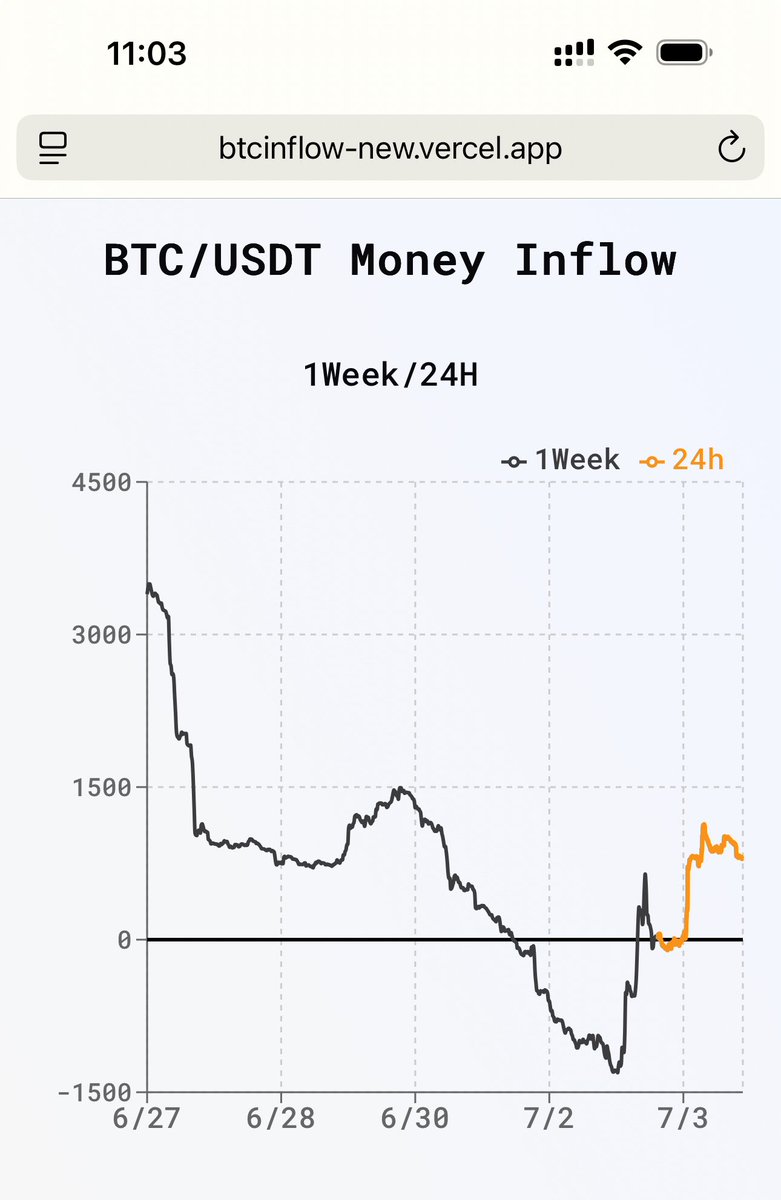
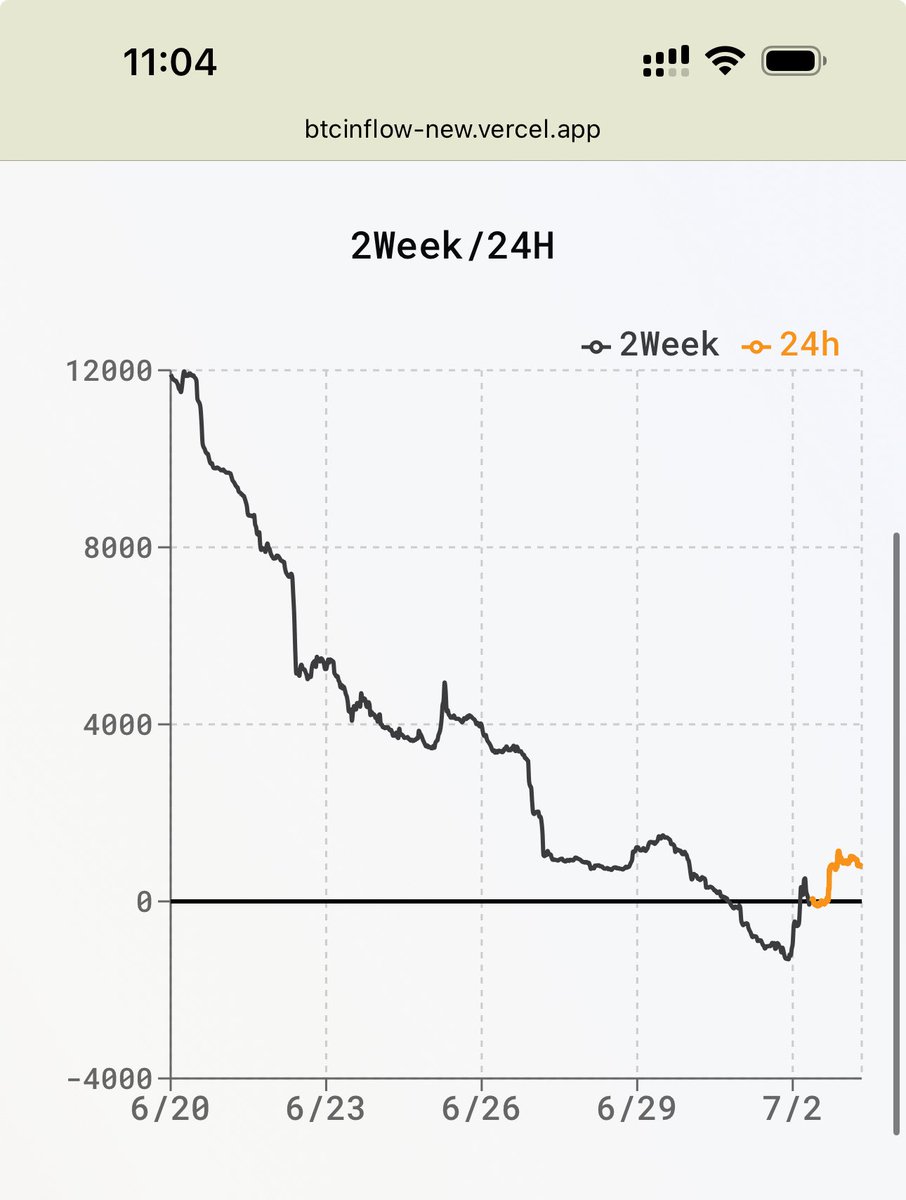
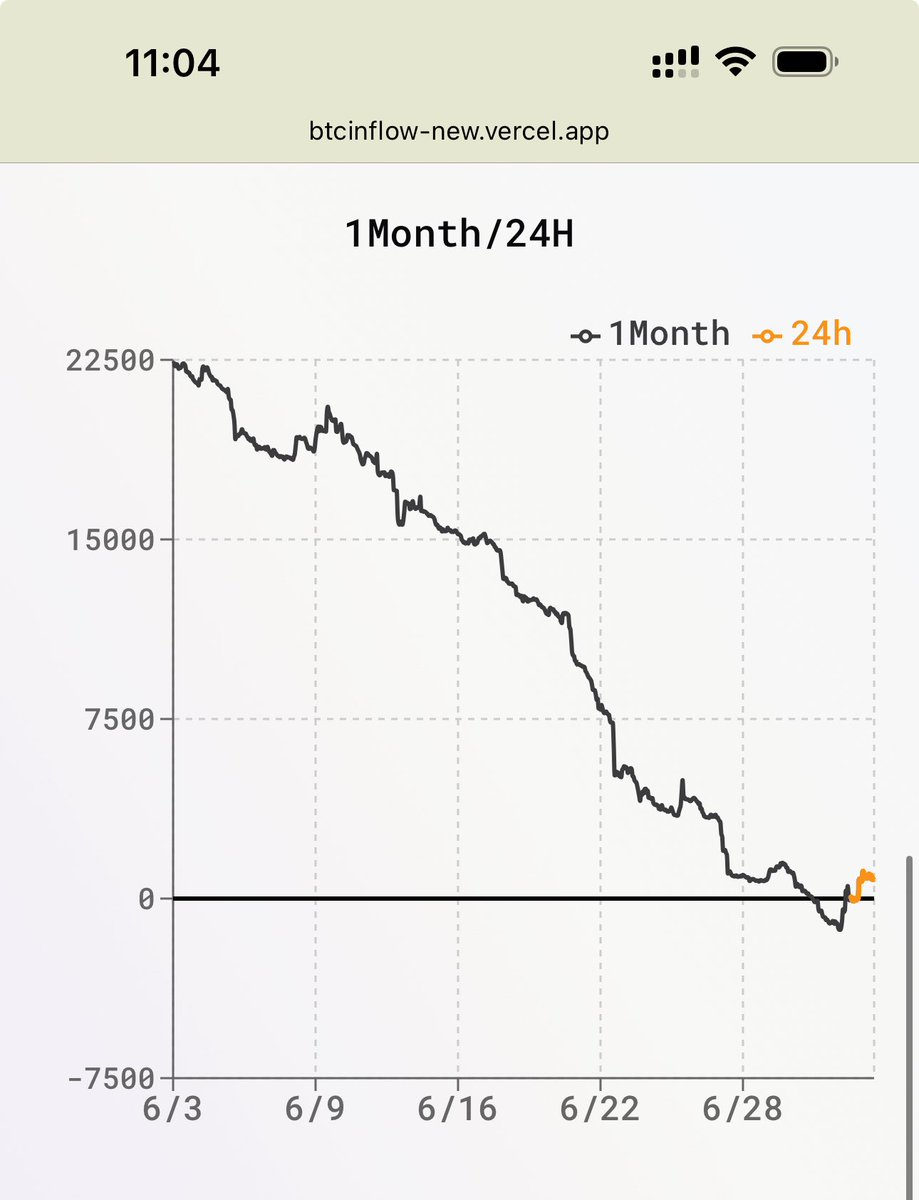
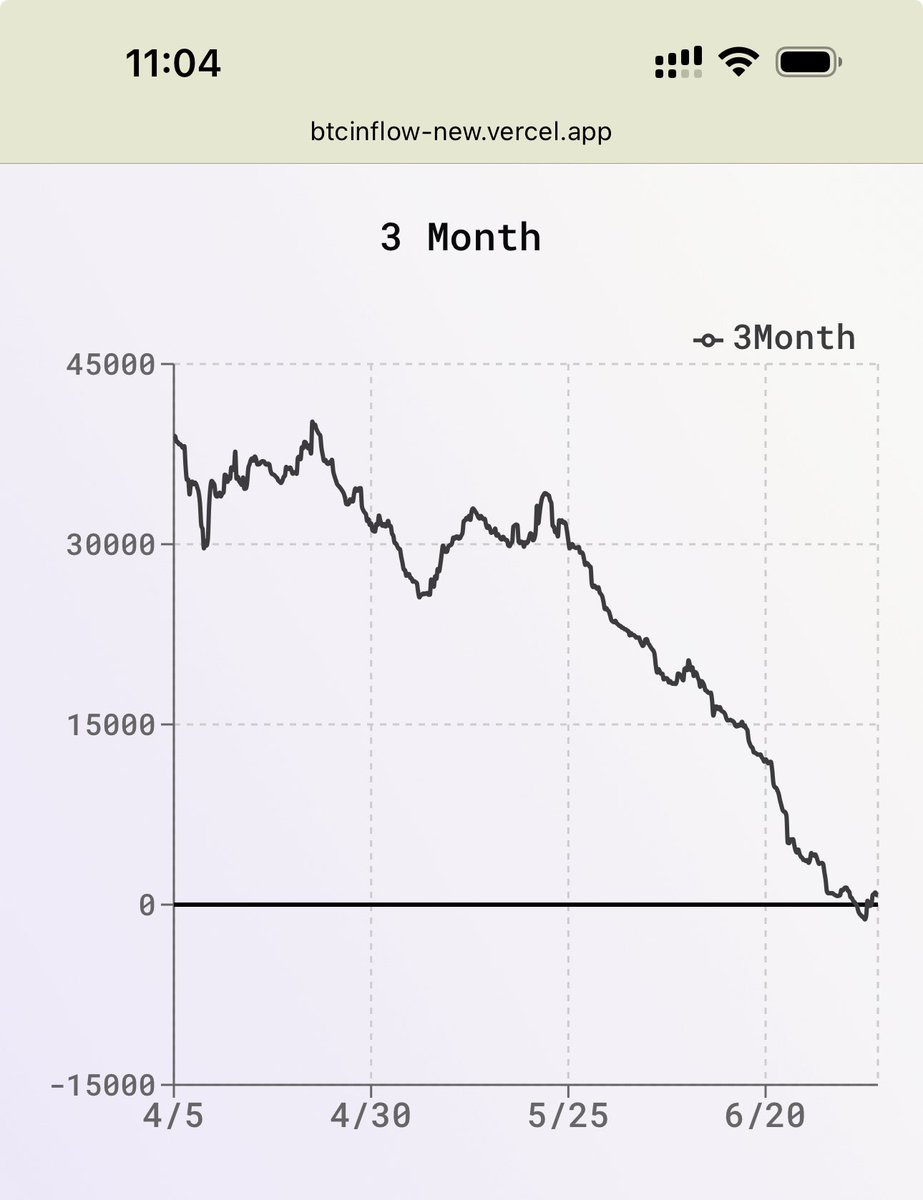
Compare and see why you need to look at this inflow and outflow chart.
After every rise, there is always a sell-off.
The money you lost has been earned by them.
Recently obsessed with technical indicators.
Now looking at the funding aspect:
In the past week, there have been three instances of capital inflow into BTC, corresponding to a price reaching 110k.
However, over the past 2 weeks, 1 month, and 3 months, it can be seen that overall capital is still exiting BTC, especially after each price surge, which is accompanied by a large amount of chip distribution exiting. This large-scale distribution started on November 20 of last year, which was when it broke through 100k.
For reference only.
10.24K
22
The content on this page is provided by third parties. Unless otherwise stated, OKX is not the author of the cited article(s) and does not claim any copyright in the materials. The content is provided for informational purposes only and does not represent the views of OKX. It is not intended to be an endorsement of any kind and should not be considered investment advice or a solicitation to buy or sell digital assets. To the extent generative AI is utilized to provide summaries or other information, such AI generated content may be inaccurate or inconsistent. Please read the linked article for more details and information. OKX is not responsible for content hosted on third party sites. Digital asset holdings, including stablecoins and NFTs, involve a high degree of risk and can fluctuate greatly. You should carefully consider whether trading or holding digital assets is suitable for you in light of your financial condition.

