Decoding the Bottom Signal: The Crypto Market's Crash and Bounce Playbook
Author: Doc
Compilation: Tim, PANews
The purpose of this article is to give you an idea of how I identify key signals in the market. We need to understand the psychological mechanisms behind risk and use this to our advantage to identify potential market bottoms.
1. The lower the consensus, the first project to collapse
When uncertainty hits, sellers sell off their least bullish assets. For example, coins with low consensus will crash first and lose blood earlier.
Think about it logically: if you need money urgently, you won't sell your valuables, but sell things that you don't usually need and are worthless.
Similarly, when traders are unsure of market movements or want to reduce risk, they tend to sell the assets on which they are least emotionally dependent to cash out.
It's no coincidence that this phenomenon happens every time Bitcoin peaks. Altcoins did not rise after Bitcoin reached the top, but rose in tandem with Bitcoin's peak. They showed signs of fatigue in the face of bitcoin earlier, having peaked a few weeks ago.
This is an early warning sign. Smart traders reduce risk before anyone else even notices what's going on.
2. Risk VS Blue Chips
Let's go back to the previous logic: people will keep their cherished high-quality possessions for as long as possible, and will only cut their love when they are desperate.
The most sought-after coins usually try to hold on to their gains as much as possible. That's why Bitcoin always looks strong, and every few weeks before a market crash, the internet is always full of tweets like "What are you panicking, Bitcoin is obviously stable".
Selling Order:
a) First of all, Shittcoins
b) Then there are the blue chips
c) Eventually all coins are sold
3. Reflexivity effects appear
Weakness leads to more weakness.
When whales start to sell in the midst of depleted demand, it induces market weakness. This is typical of the characteristics of the chip distribution stage: lack of pick-up, exhaustion of demand, and the trend of moving away.
The change in the characteristics of risky assets will make the core decision-makers of experienced traders re-evaluate their strategies.
"I couldn't sell at the top, but the nature of the market has changed. It's time to lower your exposure or close your position. "
"If this kind of decline is considered a nuclear explosion-level crash, what mines are still hidden in my account?"
All of a sudden: a position correction triggers a bigger sell-off, which is reflexive, a positive feedback loop in which risk appetite fades.
4. Volatility: The Last Dance
When the Bitcoin crash is approaching, the market is often quiet: volatility plummets, the market fluctuates in a narrow range, and complacency peaks.
Then, bang~, it collapsed.
Now, let's focus on the nature of the market in equilibrium and imbalance.
The equilibrium is achieved when market participants gradually reach a consensus on what is expensive and what is cheap. It's a dance. This is equilibrium.
Equilibrium means calm. Known information has been digested, speculation has weakened, volatility has narrowed.
This dance goes on until one party gets bored, tired, or wants to go to the bar for another drink. i.e., the buyer or seller is exhausted; Or there is a change in supply and demand.
The equilibrium is disrupted. As soon as it is broken: there is an imbalance.
The price deviated sharply from its original position. Values become obscure; Volatility skyrocketed. The market craves balance and will actively seek it.
Prices often return to areas that have recently been overbalanced: such as high volume points, order blocks, composite value zones, etc.
It is in these areas that you will see the most violent rebounds.
"The first test is the best time". The response to subsequent tests will gradually wane. The situation tends to be structured. Prices stabilized at new points. Volatility contraction. Balance reappears in the city.
5. Selling process and bottom identification
Surrender and selling is not the beginning of the endgame, but the end of the middle game.
a) Copycat vs Bitcoin
In this cycle, altcoins tend to complete major sell-offs before the Bitcoin crash.
Recent example: Fartcoin has retreated 88% from its highs before the Bitcoin crash at the end of February. Since this pattern holds, we can use it as a trading signal when looking for a signal of market exhaustion (a sign of a bottom).
While Bitcoin is still volatile and finding a new equilibrium, the strongest altcoins will be the first to show signs of relative strength and exhaustion.
To put it simply, when Bitcoin enters the late stages of imbalance, it should look for high-quality altcoins to build a balanced position.
As participants, our goal is to capture these divergences.
"Is there a shift in market momentum?"
"Is volatility narrowing?"
"Is the pace of selling slowing down?"
"Will Bitcoin still hold steady when it hits new lows?"
Q2 bottoming signals:
-
Weakened momentum (e.g. Fartcoin)
-
SFP, deviation (e.g. Hype, Sui public chain)
-
Higher lows vs. lower bitcoin points (e.g. Pepe)
Altcoins usually fall first, and then slow down when Bitcoin bottoms out.
Here's the trick to spotting a good altcoin.
The weak are always weak.
The strong quietly laid out, preempting the start of the market.
b) Bitcoin VS S&P 500
Now let's arrange a little exercise for everyone.
Combining all the concepts in this article, perhaps the following becomes reasonable:
-
Summer '23: Bitcoin peaked ahead of the S&P 500 and bottomed earlier
-
Summer '24: Bitcoin peaked ahead of the S&P 500 and digested the S&P's macro-induced plunge at the low end of the range
-
25 years to date: Bitcoin peaked ahead of the S&P 500 and withstood a 20% S&P plunge at the low end of the range
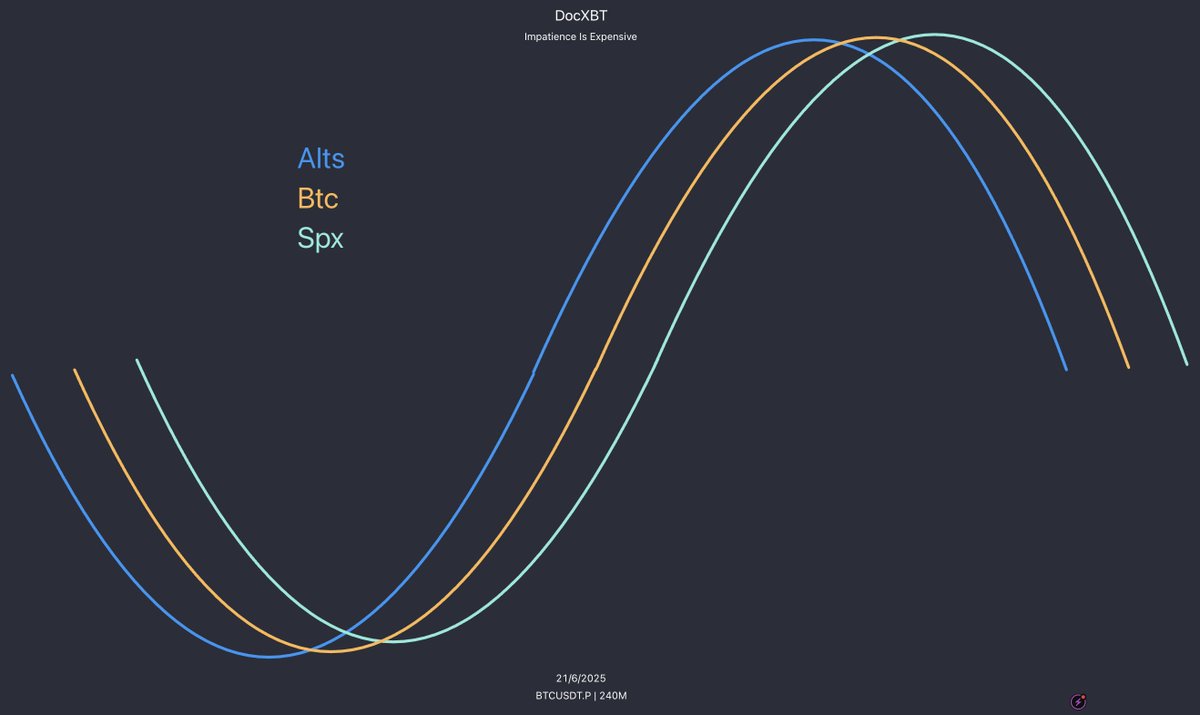
Key conclusions:
Market bottoming is a process, not an instant: altcoins come first→ Bitcoin relay → S&P comes behind
Operational Essentials: Focus on observing the evolution of market structure, rather than simply tracking sentiment fluctuations